Income Inequality In Mobile Games
When making a completely unfair comparison between income inequality in developed nations and the top mobile puzzle and RPGs in the U.S., we find a couple of interesting things.
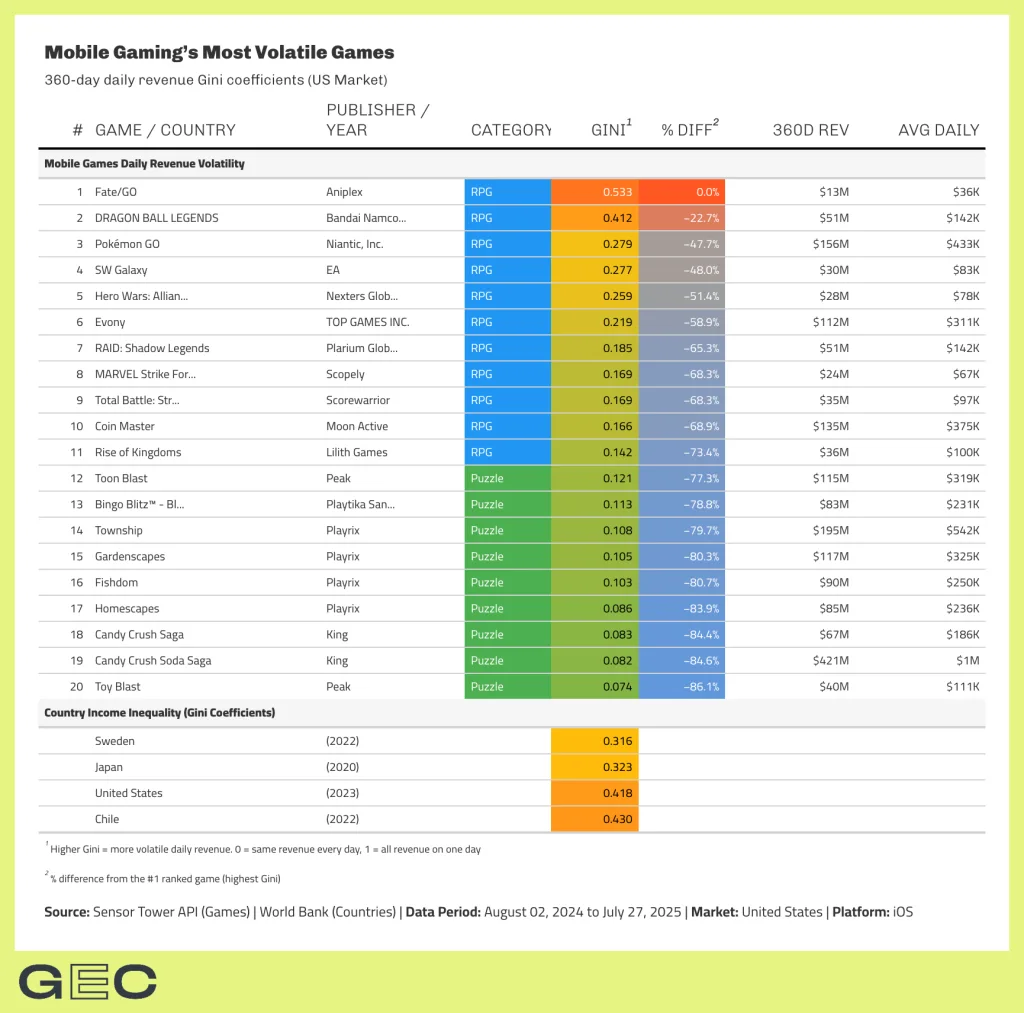
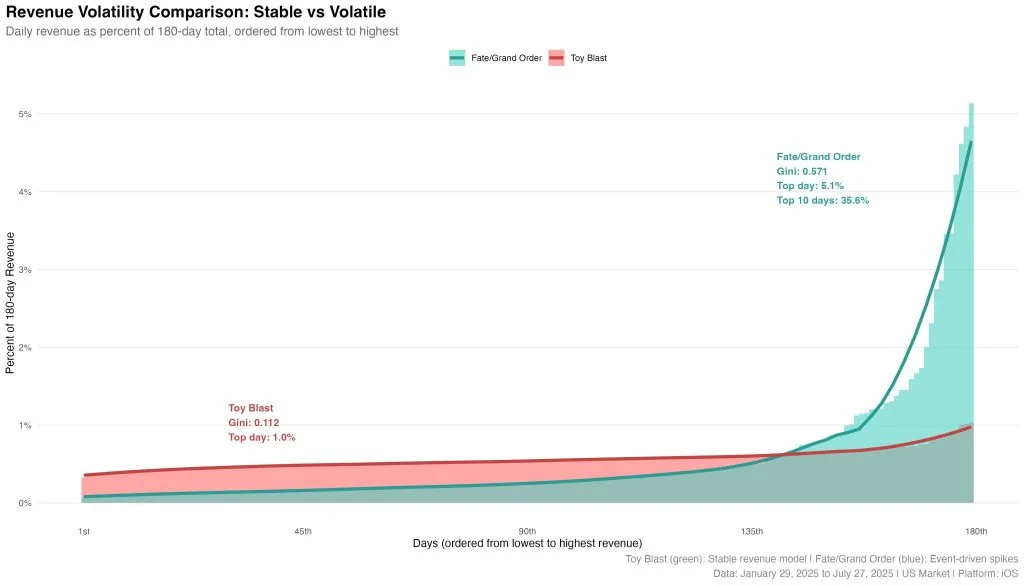
1. Unsurprisingly, RPGs have far higher Gini coefficients relative to Puzzle. The Gini coefficient here is the daily revenue inequality, i.e., how unequal are some days in revenue contribution relative to others. A Gini of 0 means each day has the same revenue contribution over the last 360 days, while a score of one indicates a single day captures the entire contribution over the last 360 days.
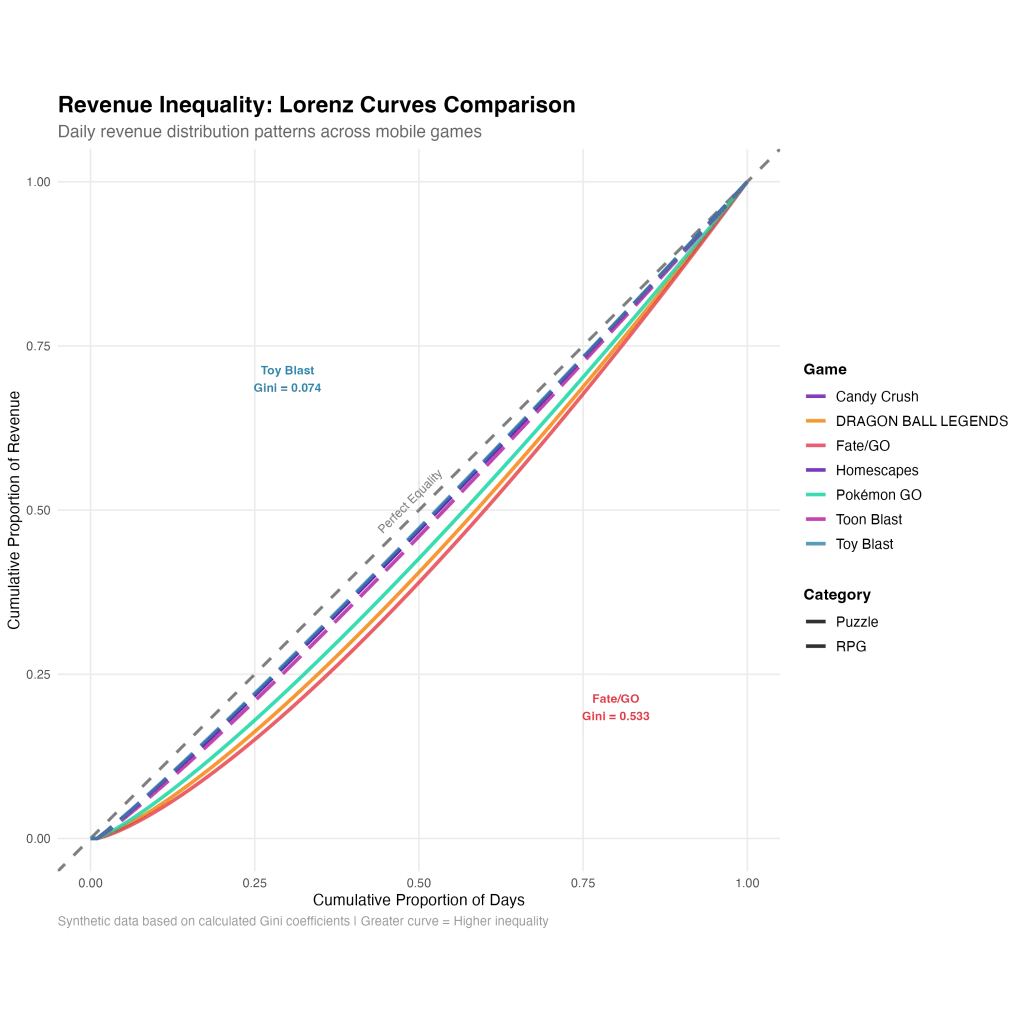
2. Two-year match paybacks are built on remarkably stable performance. Toy Blast scored a Gini of .074, near 0! It’s a whopping 86% difference from the Fate / Grand Order. Gacha games are content-sensitive, and it shows here. However, the constant levels were low; the third most unequal game (Pokémon Go) only scored a 0.27 Gini.
3. Most countries have higher income inequality than the U.S. mobile games have daily income inequality. This means nothing, but hey, why not? I’ve measured this for spender amounts within a game, and depending on the denominator (revenue/{downloads}{active users}{active customers}), the Gini coefficient ranges from 90 to 99%.
4. Match’s multiple and attractiveness to private equity make more sense after looking at this. Raid: Shadow Legends has about 2x the daily revenue inequality of a Toy Blast.