Inflation, Ads, and Webstores Change Everything We Know

Inflation, ads, and webstores reverse nearly every trend in gaming—and then reverse it again. These aren’t rounding errors either—they’re GDP-level phenomena (literally), and the inability to account for them is warping our perception of reality in the gaming industry.
- Adjusting for inflation completely reverses the growth in mobile spending between 2020 and 2023, from +8% to -9%.
- Adjusting for inflation slashes Newzoo’s 2026 PC & Console forecast by 39%, from +15% to +9%.
- Ads revenue is likely a double-digit percentage of gaming revenue, and all we have to estimate is King’s quarterly earnings.
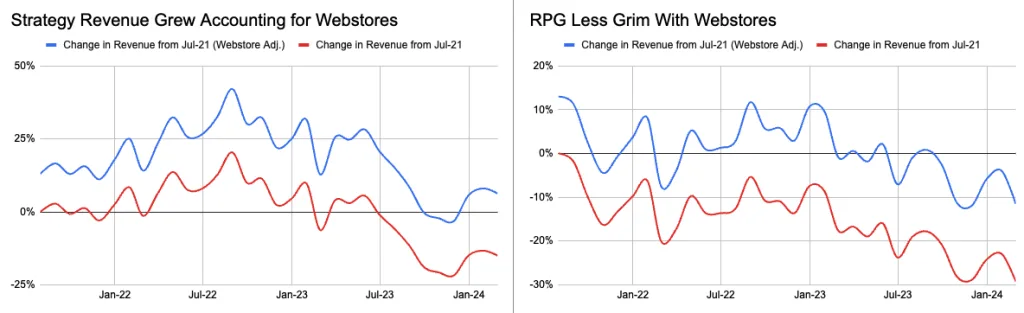
- Adjusting for webstores completely reverses the revenue decline in some midcore genres, casting cold water on the “move to the middle” thesis.
Inflation
Data.ai’s 2024 State of Mobile revealed that U.S. gaming spending grew 8% from 2020 to 2023 despite a rocky road. This was a relief after the headwinds of ATT and the post-COVID freefall.
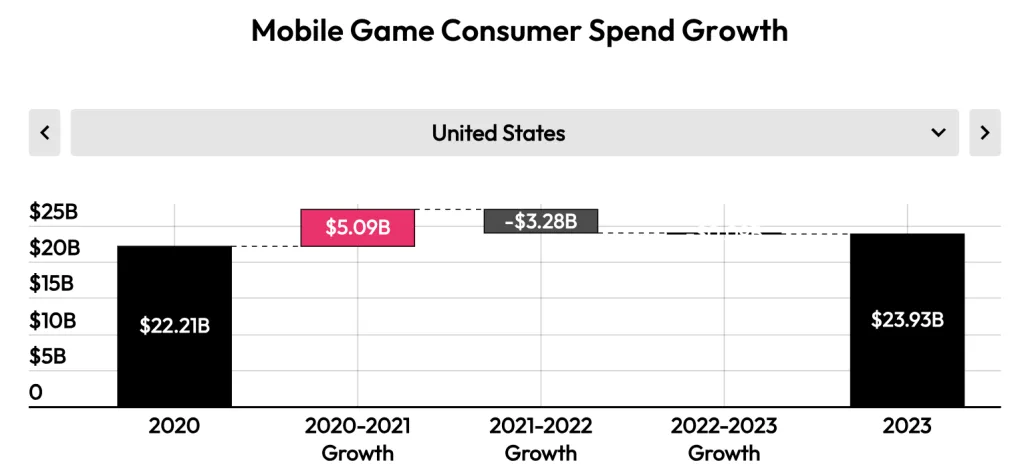
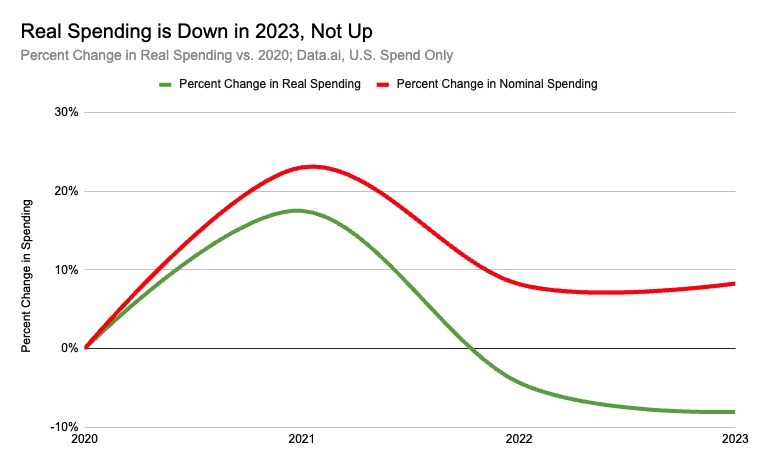
However, inflation changed dramatically over this period, with $100 in 2020 comparable to $118 in 2023 dollars. After adjusting for inflation, spending is down 9% rather than up 8%.
Newzoo’s new 2024 report follows the same pattern. They report a 52% increase in PC & Console consumer spending between 2015 and 2023. However, adjusting for inflation results in a more modest 32% increase, a -20% percentage point or -39% percent change.
The issue extends to forecasting, where Newzoo predicts a 15% increase in consumer spending from $93.5B in 2023 to $107.6B in 2026. 5However, assuming a 3% annual inflation rate, $93.5B in 2026 dollars is $102.3B. The inflation adjustment suggests a 9% real increase in spending between 2013 and 2026 rather than the 15% nominal increase, a whopping difference of 60%. These different outlooks must be adjusted to get a realistic picture of what’s ahead.
Ads
App Purchases (IAP) famously monetize a hyper-small proportion of users. In-game ads monetize the other 90% on top of freedom from the App Store’s 30% cut, but it’s hard to know the industry-level impact. Obtaining estimates is surprisingly complex. Unlike IAP, intelligence providers like data.ai and Sensor Tower can’t estimate ad revenue using credit card panel data; revenue isn’t collected at the point of viewing, instead following a sophisticated mediation process. The only coherent analysis comes from Eric Seufert’s back-of-the-envelope math derived from first-party King data. In his view:
Even if the underlying assumptions used in the article are fundamentally and severely flawed and the true extent of mobile games advertising revenue on mobile is half or a third of $100BN, it’s clearly a massive, important industry.
Eric Seufert, How Large is the Mobile Gaming Advertising Market?
Incestuous ad revenue further complicates the analysis, particularly hypercasual. These titles trade users and revenue between each other as opposed to “fresh” spend.
And if that wasn’t enough, time series analysis is complicated by lowered eCPMs post-ATT. I suspect an increasing number of games employ ads, similar to the King example Seufert reports, as technological advances have made integrating SDKs easier.
No matter how it’s sliced, ads comprise a double-digit percentage of mobile game spending, likely all game spending. If ad revenue coughs, game revenue catches a cold. The problem is that we’re trying to diagnose the illness without a thermometer.
Webstores
Webstores have exploded in popularity in another attempt to escape 30% store fees. Aided by Epic Game v. Apple, firms may now contact users with information gained from the in-app experience to direct them to off-platform payments. Lilith’s recent SquadRPG, AFK Journey, sends messages via WhatsApp to those who opted in for 5% discounts for hard currency bundles.
AFK Journey’s New Off-Platform Approach

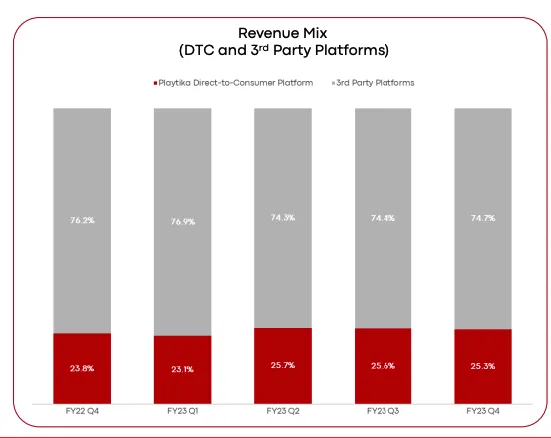
Playtika reported that webstores account for a gigantic 25% of revenue, and I’ve heard offhand that webstores reach 40% of net revenue in some products.
Playtika’s Off-Platform Payments Maxed at 25% of Revenue
We’d expect webstore usage to rise as a given player’s spending rises—heavy spenders benefit most from percentage savings. This assumption completely reverses the ATT hypothesis of a “move to the middle.”
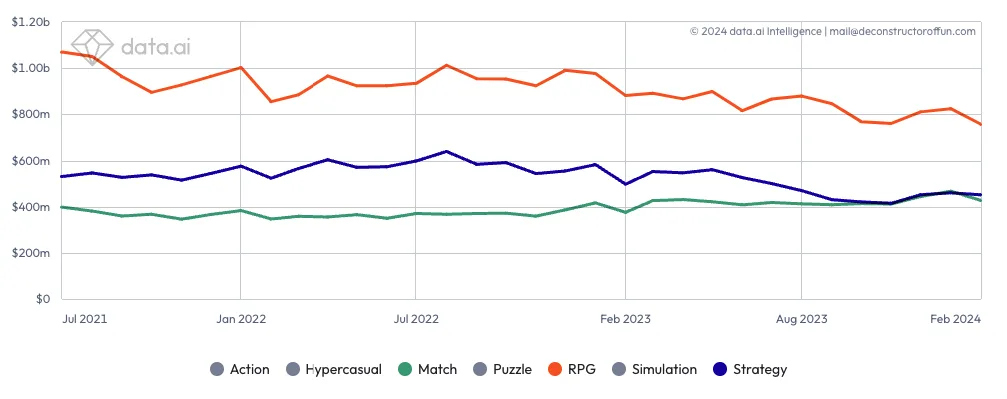
ATT reached a majority of iOS devices in Q3 of 2021, and it appears that midcore genres experienced a significant revenue decline while casual increased. RPG went from comprising 53% of the cohort’s revenue in January 2021 to 46% in Feb 2024, a drop of $250M per month, based on Worldwide revenue from iOS devices. The fall isn’t as grand as for “Strategy,” which dropped about $100M monthly between the two periods. The gains for Match are modest, about $30 per month, but it eclipsed “Strategy” for the first time in January.
Match-3 for Success? Think Again
Laying growth in webstore revenue share reverses trends. Playtika reported 13% of revenue from webstores in Q2 2020, which has grown to 25% in FY23 Q4, a jump of 12% percentage points. 6 Applying a linear trend from 13% to 25% to reported revenue between Strategy and RPG tells a dramatically different story. Strategy revenue grows by 6% (nominally!) compared to a 15% decline, while RPG declines 12% compared to a 29% decline without a webstore adjustment.
To be clear, there’s a lot of hand-waving in these estimates.
- Is using a trend line from 2020 when starting in 2021 appropriate?
- Is Playtika’s webstore revenue share figure appropriate when considering other genres? Higher? Lower?
Most importantly, to poke holes in the “shift-to-the-middle” thesis, the share of webstore revenue from midcore genres must be higher than Match. Otherwise, all that’s shown is a level shift rather than a relative change in the revenue mix between genres.
We Hang Together or Separately
Where does merging inflation (revenue down), ads (revenue up), and webstores (revenue up) leave gaming as a whole? Quite frankly, I don’t know. But I do know these ticket items are huge movers of industry GDP. The absence of evidence isn’t evidence of absence, but we need to start building that very evidence. At a minimum, intelligence firms should adjust for inflation, while I know webstore revenue and more robust ad revenue reporting are on the roadmap. Next time you see an estimate, be the annoying guy in the back and ask, “is this adjusted for inflation?”