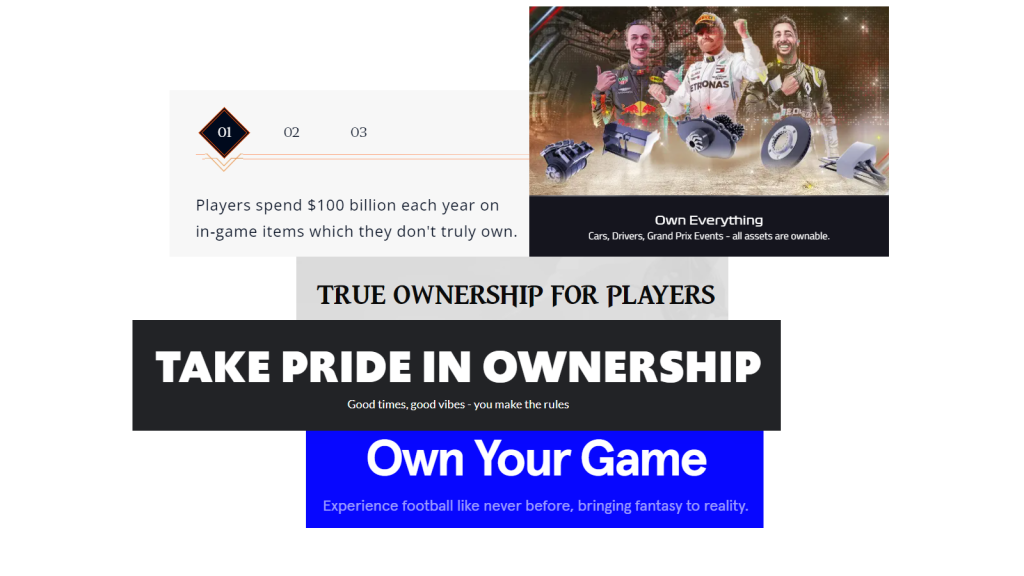
Take a stroll through a blockchain game website – they are all lovely; remember that’s their UA funnel! – and a standard set of phrases appear: “ownership,” “true ownership,” “truly owning.”
Is everyone hiring the same marketing brand guy?
But blockchain warps the traditional meaning of ownership into a ship of Theseus problem; each blockchain-based game can define ownership in its context. Suddenly, ownership becomes a design space in itself, making it all that much more crucial to dissect and analyze.
Sorry readers, I caught the blockchain bug. When 30-person firms get $4.5B valuations, it’s time to pay attention, regardless of one’s priors. Everyone seems to have a Blockchain hot-take, but I’ve found most to fall short of ruthlessly integrating the implications and design space of the technology. Blockchain players (who are also, by definition, investors) insist, at every turn, that it’s so obvious blockchain gaming is the future. Advocates cite specific benefits – true ownership, play-to-earn, “aligning incentives between players and developers,” and decentralization. A smaller crowd expresses skepticism about what blockchain solves for gamers, and if blockchain has the implications, advocates think it does. This mounts a normative and positive element to discussions of blockchain. On cue, Benedict Evans offered a measured assessment of the situation:
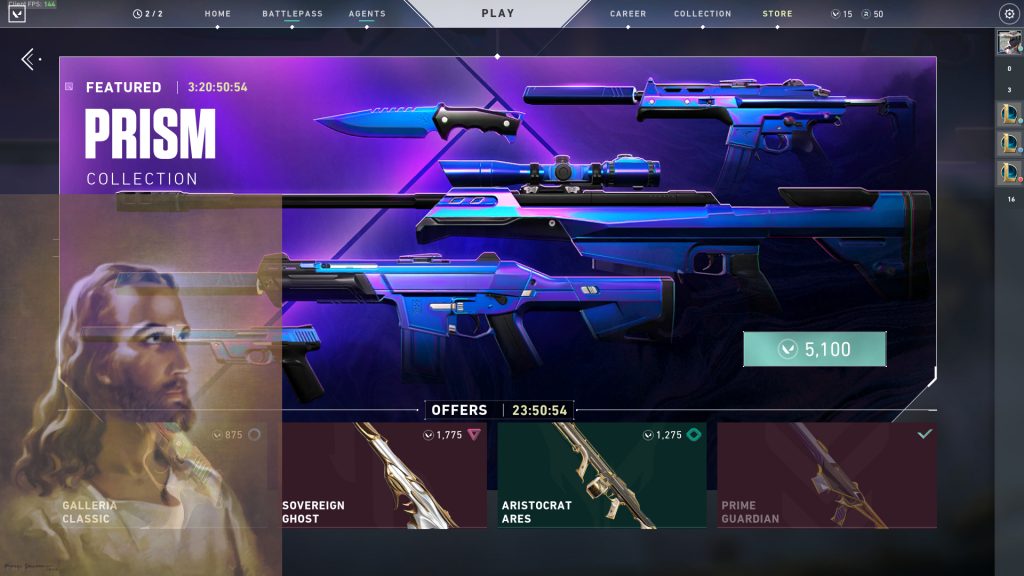
A good deal of odd and folk-lore design priors float around gaming; my two favorites are free hard currency and time-limited cosmetics predicated on FOMO or fear of missing out. The FOMO model suggests developers ought to stuff their game with time-limited content, once the timer is expired the content is gone forever (or for a long time – a year or more). I’ve argued paper-thin theory holds up free hard currency, but small revenue stakes drape it as a marginal issue, whereas the FOMO model has a far more significant impact on the bottom line. High-stakes decisions demand more substantial evidence than low-stakes decisions, and we don’t yet have one for the FOMO model beyond “Fortnite does it.” Is there a persuasive and substantial case for FOMO?
Battle Royale and Roguelike are remaking game progression before our eyes. Popularized in earnest during the rise (and eventual pruning) of the MOBA genre, in-round progression mandates players accrue vertical power in the context of a single round.
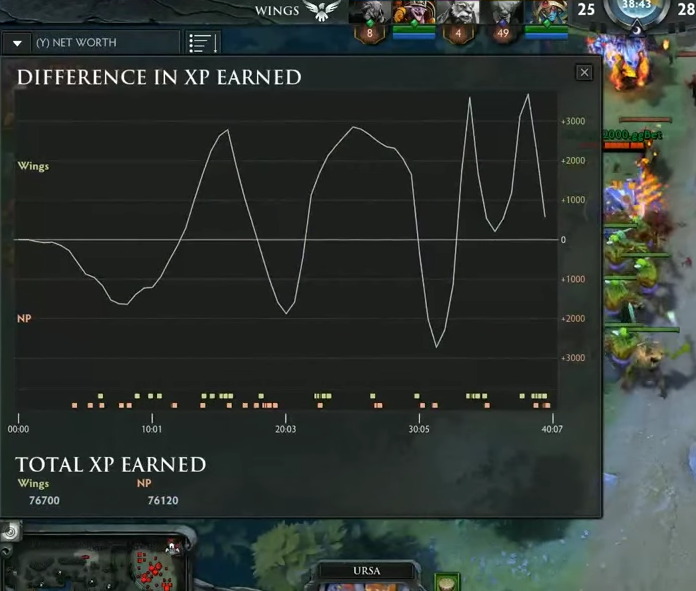
MOBA sessions start with players farming in-round currency to spend on items that persist until the round or particular game is over. In addition to in-round currency, players earn XP that levels up characters for the round duration. Many teams secure victory by out-farming currency and XP relative to the opposing team; eSports commentators are fond of displaying progression charts during casts. A single XP chart becomes the scoreboard of the game and a big predictor of victory.
In-round progression completely alters the salary profile game designers pay players. If we think of rewarding player action with progression as a wage rate, in-round progression radically alters the incentives. Instead of optimizing for the long-run, in-round progression presents a 30-60min time horizon to players.
If only he were around to experience hard currency today.
One of my favorite folk-lore design positions is the notion of giving away free hard currency. Without hesitation, every product manager I’ve worked with will off-handily assert the “drug-dealer” model. Supposedly, after experiencing the wonders of hard currency, players will be more likely to spend real money on hard currency rather than just enjoying the free stuff. While free giveaways sound nefarious, it’s a common strategy in nearly all walks of commercial life: streaming services, cars, software, and Costco all employ trial mechanics to no moral confusion or controversy.
Despite strong priors displayed by PMs, I’ve never seen empirical evidence supporting the claim. But more importantly, I’ve never seen the argument entirely fleshed out. For example, does the theory suppose I’d maximize conversation if I gave players $100 worth of hard currency? Or will a mere $1 of free hard currency suffice? Do I send players hard currency on a schedule, or is an initial allocation enough? In true freetoplayeconomics.com fashion, we need a model!
Robert Mundell often remarked getting to tier 100 in the Battle Pass is harder than getting a Nobel Prize
Game monetization discussions tend to focus on what to monetize broadly (gameplay or cosmetics) as well as how to price it. As someone might imagine, these are crucial and foundational discussions to have. So naturally, therefore, it makes sense to invest a lot of human capital into optimizing them. Increasingly, however, I’ve become convinced that just making lots of stuff trumps all other optimizations. Instead of being an afterthought, supply-side considerations deserve to be front and center.
subscribe to the blog subscribe to the blog subscribe to the blog subscribe to the blog subscribe to the blog subscribe to the blog subscribe to the blog subscribe to the blog