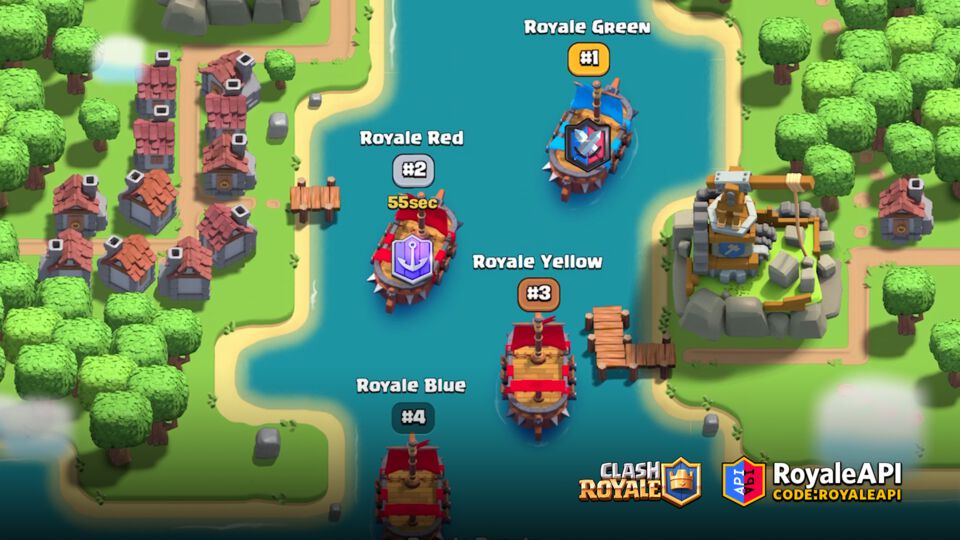
Ran Mo retraces the incredible fast follow of the auto-chess genre. Before you could blink an eye, what was a mod in Dota 2 (which itself was a mod) had spun off into three incarnations. The first was from the mod maker, Drodo Studios’ plainly labeled Auto Chess, the second was Valve’s Underlords, and the third was Riot’s Team Fight Tactics. It’s not clear any of them have done “well.” Indeed, none of them are making any real money as there’s little to purchase amongst any of them.
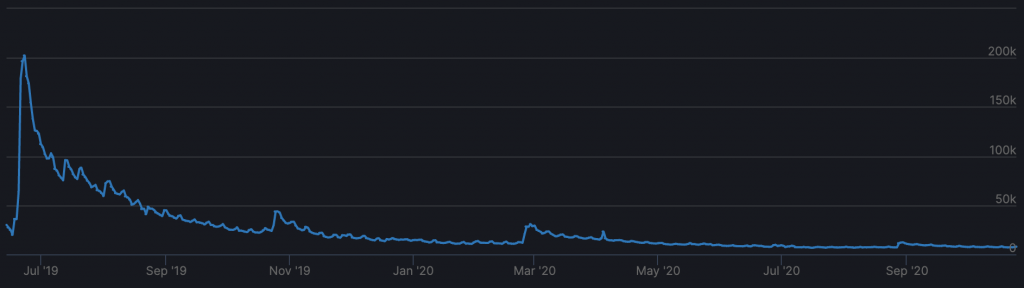
Valve’s Underlords PSU Declines
But if there is a leader, it’s Riot’s Team Fight Tactics (TFT) by content cadence (from a player count perspective, it’s unclear if TFT is doing something meaningful). How do we explain the last entrant who is now leading the pack? Ran seems to argue for the power of the platform:
“Underneath the hood of League of Legends is a deep set of systems and tools: messaging and voice chat systems, social systems, matchmaking, internal development tools, event systems, cloud-based server infrastructure, post-game data analytics, and so on. These tools enhanced play experiences and supported the continuous release of contents, events, and updates.”
Ran further explains, “We’re likely entering a new wave of consolidation today, with new moats centering on live-service ecosystems […].”
I could not disagree more. Not simply on Riot’s platform power, but also in the broader value of game platforms altogether. Game platforms have, and will always be, valueless: there is too much game specificity and velocity for meaningful platform features to scale. “[…] messaging and voice chat systems, social systems, matchmaking, internal development, I could not disagree more. Not simply on Riot’s platform power, but also on the broader value of game platforms altogether. Game platforms have, and will always be, valueless: there is too much game specificity and velocity for meaningful platform features to scale. “[…] messaging and voice chat systems, social systems, matchmaking, internal development tools”? While standard and required for live service, they are not “deep.” If these features form a moat, it’s the equivalent of a kiddie pool defending Versailles. The ever-growing number of PC game launchers, all of whom do these exact things, suggests as much. The primary value of game “platforms” is discovery and perhaps security.
The deeper platform features of Steam (Marketplace and Workshop) have failed to see widespread adoption. Other platforms haven’t even built anything beyond a friends list and chat. None of them can justify a 30% cut, and for many games, “multi-tenancy” or listing on multiple platforms is the clear revenue-maximizing strategy. Of the top 20 Steam games, only 35% of non-Valve games use Marketplace or Workshop. Furthermore, 59% are multi-tenant or are on other PC launchers. Expect this to increase as Steam degrades as the sole game discovery launcher. Activision realized this long ago when they shifted Call of Duty to Blizzard.net and away from Steam. Blizzard titles anchor the launcher with eyeballs but do little feature work. It’s 2020, and the Blizzard region still locks many titles, meaning switching from NA to EU servers entails losing all progression for some titles.
Other firms take game platforms to eat at specific parts of the game “supply” chain. In addition to a given piece of technology working for games, these firms hope the tech will also scale outside of games. This is an executive fetish that rarely, if ever, pans out. Machine Zone (MZ) is the latest failed entrant into “but we’re really a tech company”. Cognant ‘s internal ad-buying platform, Cognant, and its cloud platform, Satori, went up in flames. MZ ended up selling to AppLovin at 10% of its peak value. The jury’s out if Improbable, the latest “but we’re really a tech company,” can dig out of $85M losses. A more considerable hope is Unity, but even then, only 8% of the 716 customers to spend $100,000 or more have been non-gaming firms—games as a technology, an executive fetish that rarely, if ever, pans out. Epic’s PR team was out in full force, tracking The Mandalorian using Unreal, but this is a minuscule share of Epic’s revenue. Games have similar challenges to tech firms, but tech firms rarely have identical challenges to games (all squares are rectangles, but not all rectangles are squares). A common theme of this blog, reiterated in this series, is that games are a distinct and unique medium. The faster we embrace this, the quicker the industry can evolve.
While game companies may never be tech companies, there may be a small place for game technology companies. Unreal and Unity are real and here to stay—they solve complex and prevalent problems game makers face. The total addressable market for game tech solutions grows if the games industry grows. Is there room for more game technology companies beyond Unreal and Unity? The previously mentioned Improbable seems to think so, but little additional evidence exists.
There’s more to be said for a game as a platform, but the evidence is still scant. Publishers haven’t been able to retain the value of extensions within a given title (Auto Chess splitting from DOTA 2) or outside of it (MOBAs splitting from Warcraft III and Heroes of the Storm). The simple ability for players to build content within games hasn’t precisely accelerated either. If anything, modding has become more challenging, not easier, since its ascent in the early 90s. Can we think of a single major 2020 release to embrace mods? Much was made of Halo 33’sForge, but we’ve seen few copycats since its release in 2007. If we consider a corollary to Bill Gates’ definition of a platform, it might go something like this: “A game is a game platform when the playtime of platform content eclipses the main game.”In this view, there hasn’t been a modern game as a platform. A softer version might consider a game a platform when “he playtime of additional modes eclipses the main game.”Despite a much lower bar, it’s not clear that Fortnite, with its concerts and social spaces, has reached it either.
We’re left with Roblox, a trustworthy game platform. Roblox provides valuable tools that make it easy for developers to create compelling games and facilitate discovery. But the jury is out on whether to consider this the future of games, especially with its elder sibling, Manticore, going nowhere fast.
RPGs vary from CCGs, which vary from FPSes. FPSes might need to solve 64-player servers, CCGs may need transfer markets, and RPGs need deep customization systems. This specificity of these challenges shrinks the total addressable market for the tech solutions that game firms have devised. Central platform features haven’t adapted to a particular game design (and the speed at which it changes). As a result, we’ve rarely seen game companies make a successful transition to a tech firm.